
bode plot tutorial using Matlab 20
[otw_is sidebar=otw-sidebar-1]
Bode Plot
A Bode Plot is an important tool for designing and analyzing the circuits especially the feedback circuits. A Bode plot technique is based on designing and analyzing the electrical / electronic circuits in the frequency domain. This technique is named after the man who created it Hendrik W. Bode. The concept of Bode plot is of significance in many applications especially in Communication and Control systems. It is important to note here that there are two approaches for circuit analysis and design that is:
- Classical Approach for analysis and design.
- Frequency domain analysis and design.
Let us discuss each briefly:
Classical Approach for analysis and design:
The classical approach for designing and analyzing the circuits is also called the time domain analysis and designing that is, in this method of analysis and design we mainly focus on the time domain representation of the system. That is the system input and output relationship is completely described in the time domain using the differential equations. Although this technique is quite useful, but it is not as much intuitive as the frequency domain analysis and design.
[otw_is sidebar=otw-sidebar-3]
Frequency Domain Analysis and Design:
Frequency domain analysis is comparatively more intuitive approach for circuit designing as compared to the classical approach. As the name implies this type of analysis and design approach considers and manipulates the frequency domain representation of the system and its input and output relationship. The representation of the input and output relationship of the system in the frequency domain is called the transfer function of the system. The time domain representation of the system can be converted to the transfer function using the Laplace transform. It is important to note here that the variable in the frequency domain representation of the system is ‘s’ which is complex frequency variable which means that the behavior of the system represented by the transfer function corresponds to the frequency variable so the frequency domain analysis mainly focuses the frequency point of view or behavior of the system.
Frequency Response:
In order to understand the Bode plots one should have a sound knowledge of the Frequency response of the system. Let us first try to understand the Frequency Response and then we will move to the Bode Plots. The frequency response of the system compliance the variation of the magnitude and phase shift of the output signal corresponding to the change in the input signal for particular range of frequency. In other words the output signal of the system changes in both the magnitude and phase when a system is subjected to the input signal that varies for a particular frequency range and the behavior of the magnitude and phase of the output signal can be represented in the form of the function and this function is called the Frequency Response in short frequency response of the system gives the knowledge about the magnitude and phase shift of the output signal in response to the input signal.
Definition:
[otw_is sidebar=otw-sidebar-2]
“The frequency response of the circuit is the behavior (magnitude and phase) with change in signal frequency”.
The generic representation of the frequency response of the system is shown below:
The expression in the figure is called the Transfer function and it is also called the network function. The frequency response is actually the plot of this transfer function. The omega in the above expression is the frequency variable and the transfer function represents the variation of the magnitude and the phase of the output signal of the system with respect to the variation in the input signal frequency.
bode plot of Transfer function:
“The transfer function H (w) of a circuit is the frequency dependent-ratio of a phasor output Y (w) and phasor input X (w).”
The concept of the transfer function can be understood by the following diagram:
Frequency Response and the Bode Plots:
After we have grasped the knowledge of the Frequency response of the System it is now time to move on to the concept of the Bode Plot. It is important to mention here that the Bode plot is of two types:
Bode Magnitude Plot.
Bode Phase Plot.
The Bode plot as the name suggests is the graphical representation (plot) of the frequency response of the system. As we noticed earlier that the frequency response compliance the magnitude and phase response of the circuit with respect to the frequency variation of the input signal. So the plot of the magnitude response of the circuit is called the Bode magnitude plot and following the same context the plot of the phase response of the circuit is called the Bode phase plot. On the Bode Plot the magnitude in case of the Bode Magnitude Plot and the phase in case of the Bode Phase Plot is represented on the ordinate and the frequency is shown on the abscissa.
Definition:
“The Bode Plot is the industry-standard for representing the Frequency response of the system graphically”
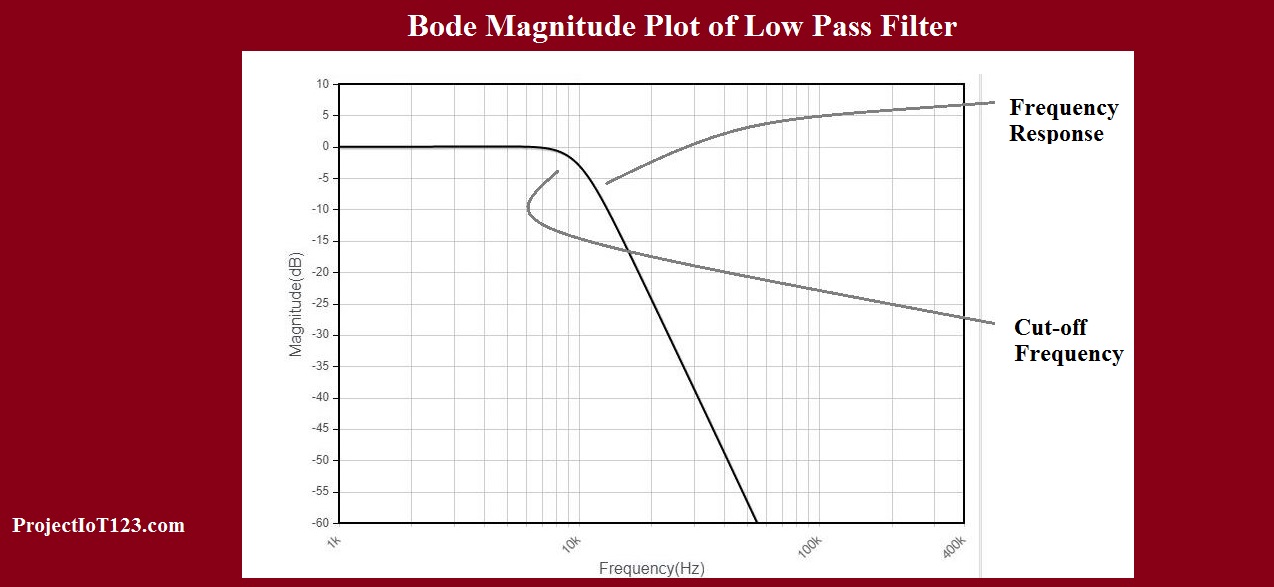
The following figure shows the Bode Magnitude plot of the High Pass Filter and Low Pass Filter respectively:
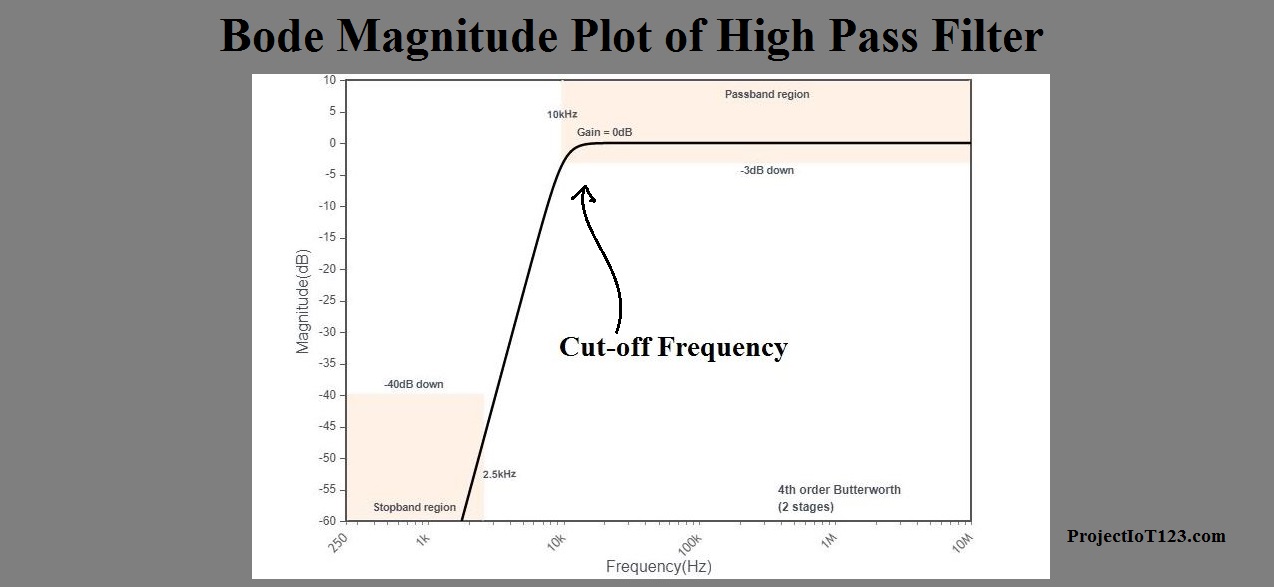
As can be seen in the figures above that the Magnitude of the output signal is shown on the Y-axis and the frequency range of the input signals is shown on the x-axis.
In the similar way the Bode Phase plot of the frequency response of the system can also be plotted. Thus we conclude that the Bode Plot of the system is the Graphical Representation of the Frequency Response of the System and the frequency response of the system can be obtained from the transfer function of the system. The frequency response of the system is composed of the magnitude and phase response of the system and thus the Bode plot has two parts Bode Magnitude Plot and Bode Phase Plot.
[otw_is sidebar=otw-sidebar-3]
That is all for now I hope this post would be helpful for you. In the next post I will come up with more interesting educational stuff. Till then stay connected, keep reading and enjoy learning.
zestril pill lisinopril 20 mg canadian lisinopril 20 mg tablet price
https://cytotec.club/# buy cytotec
prinivil drug cost: zestoretic 10 mg – lisinopril 40 mg for sale
tamoxifen mechanism of action tamoxifen estrogen tamoxifen menopause
https://ciprofloxacin.tech/# purchase cipro
http://finasteride.store/# cost propecia online
cipro 500mg best prices: buy ciprofloxacin – ciprofloxacin order online
https://nolvadex.life/# generic tamoxifen
how cÉ‘n i get cheap propecia pills: propecia without rx – cost of generic propecia pills
get cheap propecia no prescription buying cheap propecia without insurance cheap propecia without prescription
http://cytotec.club/# cytotec online
http://ciprofloxacin.tech/# purchase cipro
cytotec online Cytotec 200mcg price buy cytotec pills online cheap
tamoxifen and depression: nolvadex 10mg – nolvadex estrogen blocker
http://ciprofloxacin.tech/# buy cipro online
cost propecia without dr prescription cost generic propecia without dr prescription order generic propecia no prescription
zestril 2.5: zestoretic 20 25 mg – lisinopril 30 mg cost
ciprofloxacin generic price: cipro – buy cipro cheap
http://lisinopril.network/# lisinopril in usa
antibiotics cipro ciprofloxacin order online ciprofloxacin generic